
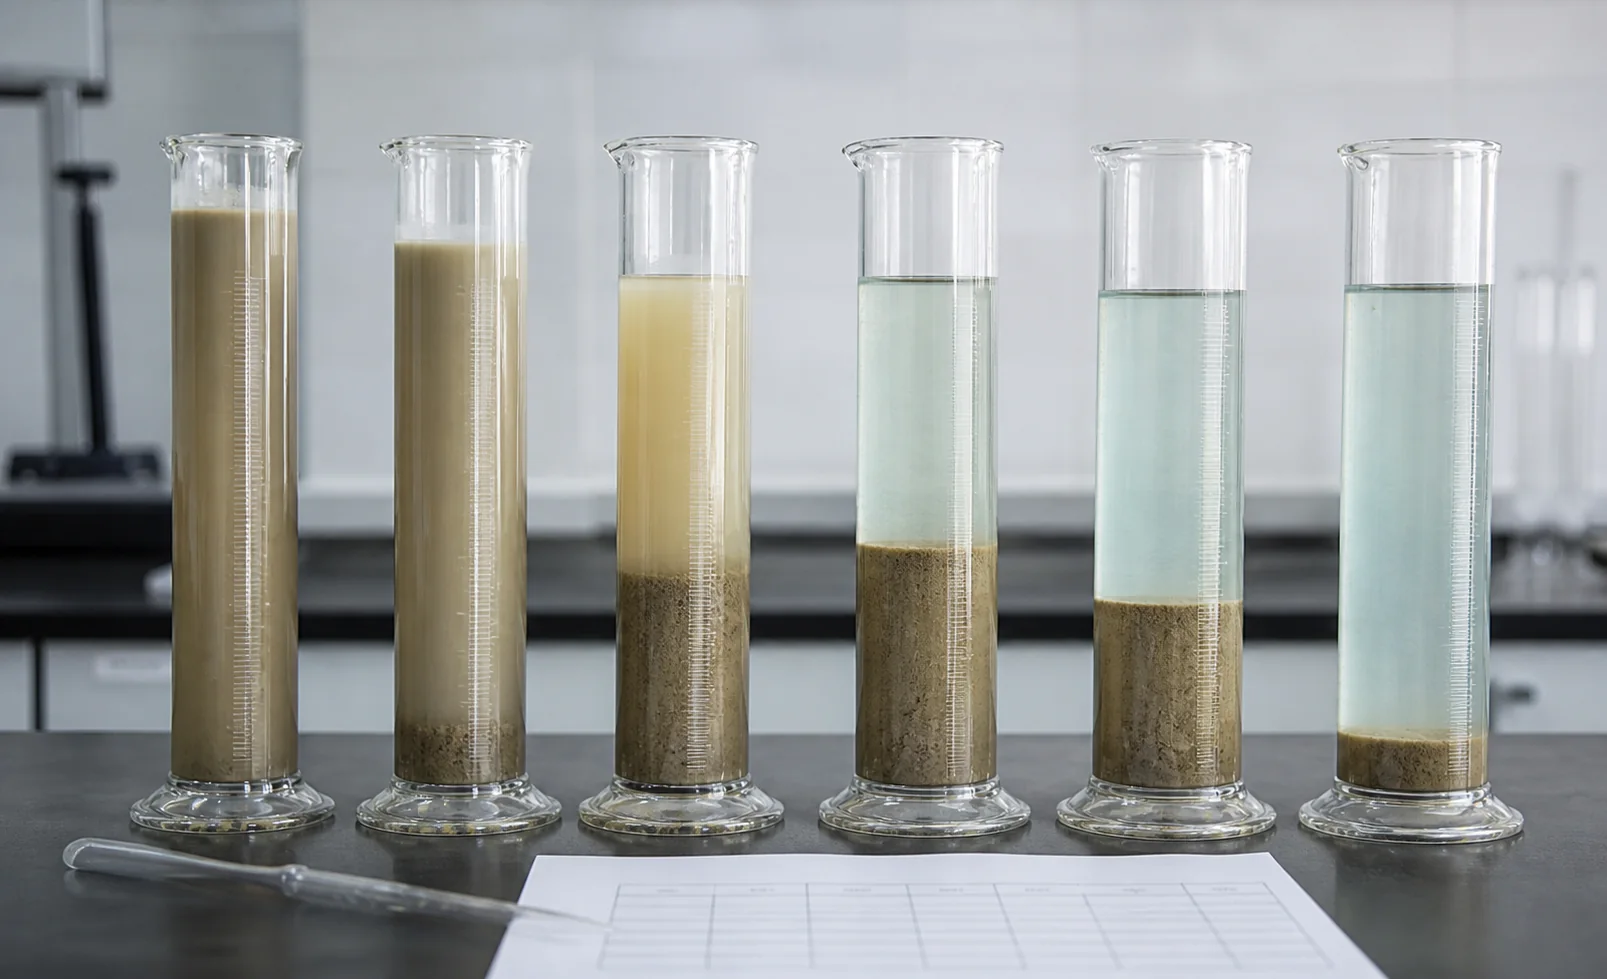
Anionic PAM selection is a controlled comparison between the solids, water chemistry and separation duty. The label describes polymer charge, but it does not predict the best product code or dose on an unknown feed.
Describe the particles before choosing samples
Record the solids source, mineral or precipitate type, particle-size distribution, clay or ultrafine fraction, concentration and density where relevant. Note whether the feed has been ground, washed, oxidized, neutralized or exposed to flotation, dispersing or cleaning chemicals.
Fresh representative material matters. Settling during transport can remove fines from the test portion, while storage can change precipitates and biological contaminants. Homogenize gently and document collection time.
Map the dissolved chemistry
Measure pH, conductivity and temperature, and record hardness, salinity or dissolved metals when they may affect the process. Multivalent ions can promote interaction between anionic polymer and negatively charged mineral surfaces, while extreme chemistry or competing reagents can change response.
Use actual process or recycle water for the primary comparison. A product prepared and tested only in deionized water may behave differently in a closed circuit.
Separate coagulation from bridging
PAC, alum or ferric may first reduce repulsion or create metal-hydroxide microfloc. Anionic PAM can then bridge those structures. Keep the coagulant condition fixed during the first polymer screen. Include untreated and coagulant-only controls so the source of improvement is visible.
When no coagulant is used, do not assume that a higher anionic charge will force a response. Compare a small charge and molecular range and be prepared to test another ionic family.
Build a focused candidate matrix
Ask for products that differ in a stated selection dimension, such as charge range, molecular architecture or product form. Prepare them with the same water, concentration, induction, agitation, maturation and solution age. Dose on active mass, not equal solution volume when concentrations differ.
Use several dose points around the first response. A single jar cannot reveal the width of the operating window or the appearance of overdose.
Measure the separator endpoint
For clarification, measure settling time, supernatant turbidity and sludge volume. For thickening, add interface velocity, compaction and shear response. For filtration, measure drainage or filtrate volume, solids capture, cake and media condition. The same polymer can rank differently under different endpoints.
Apply a repeatable shear step when plant transfer or feedwell mixing is significant. Large fragile floc may look excellent before it reaches the separator.
Choose a controllable window
Identify underdose, the practical middle range and overdose. Repeat the finalists on another representative sample and confirm them at plant scale. Record feed condition, product and lot, solution method, active dose, mixing and measured results.
Select the grade that satisfies all critical limits across expected variation. A narrow peak result is risky when operators cannot hold feed solids or chemistry at one point.
Prepare the sample request
Send the particle and water record, equipment, current chemistry, active dose, endpoints, quantity and destination. Link the request to the separation-goal product selector so the supplied candidates answer a defined plant decision.
Use simple observations before advanced analysis
A disciplined screen does not require every surface-chemistry instrument. Consistent settling columns, timed interface readings, supernatant turbidity, final bed volume and a repeatable shear step can identify whether a candidate has a useful response. Zeta potential, charge-demand or particle analysis can support diagnosis, but results must be tied to the same representative feed and a defined method.
Write the expected response before each controlled change. If added hardness improves clay flocculation, or a fixed coagulant creates a response that raw feed lacked, the observation helps explain the mechanism and guides the next sample set. Avoid interpreting every result only after the test is complete.
Plan for feed variability
Repeat the shortlist on normal and difficult conditions when ore, aggregate source, wastewater batch or recycle chemistry changes materially. A candidate with a slightly lower peak settling rate may be easier to operate if its dose window remains broad across those conditions. Define a practical range of feed solids, pH and conductivity rather than one ideal sample.
Include the blank, current product and one repeated finalist in each session. Repetition separates a real product difference from splitting, preparation or operator variability.
Create an approval record
The final record should identify sample source and time, product and lot, stock concentration and age, active dose, mixing, interface readings, water result, bed or cake result and downstream equipment condition. Keep reasons for rejecting a high dose or visually impressive fragile floc.
This evidence prevents purchasing from reducing the decision to a generic high-molecular-weight or high-anionicity label and gives technical staff a baseline when process performance later shifts.